Looking to change your energy platform? JOBI ensures your data, assumptions, and decisions remain usable, not stranded in reports or disconnected systems.
The real risk isn’t missing data. It’s losing momentum when tools don’t last.
Platforms generate insights but rarely preserve decision context
Reports get delivered but aren’t connected to action or outcomes
Capital plans are created but assumptions fade once projects begin
Teams change and hard-won knowledge quietly disappears
JOBI is built to prevent that loss by turning energy work into a living, compounding asset.
From disconnected tools to a continuous decision platform.
JOBI connects audits, utility data, planning assumptions, execution tracking, and measurement & verification so every step informs the next.
Monitor & Evaluate
Track how your buildings perform month to month and find new opportunities for efficiency.
Transform Reports into Action
Move beyond reports by linking audit data into live, usable data for real-time decision-making.
Plan & Implement with Confidence
Identify issues early and create energy strategies to meet your goals and seek available funding.
Own Your Energy Decisions
Achieve energy sovereignty with data you control, strengthening accountability and funding readiness.
Collaborative software where everyone sees the same data, strengthening accountability and funding readiness.
How JOBI Sustains Decisions Over Time
Discover how JOBI helps you monitor building energy performance year-round.
STEP 1
Capture & Normalize
System of Record
Ingest utility bills, ESPM data, meters, audits, and legacy studies into a single system of record.
STEP 2
Visualize & Benchmark
Performance Tracking
Track energy, water, cost, and emissions performance month-to-month across buildings and portfolios.
STEP 3
Model & Compare
Scenario Planning
Evaluate scenarios, incentives, trade-offs, and sequencing before capital is committed.
STEP 4
Execute with Accountability
Delivery & Tracking
Track approvals, incentives, and implementation with full accountability.
STEP 5
Verify & Learn
Institutional Memory
Measure actual results and feed outcomes into future strategy.
Energy Intelligence Loop
JOBI doesn’t stop at insight, it preserves context, verifies outcomes, and strengthens every future decision.
A Subscription Model Aligned to Responsibility & Risk
As confidence and ownership increase, JOBI supports deeper planning, execution, and accountability.
Monitor
Visibility & system of record
$
19 /building/month
Utility data ingestion (PDF → data)
ENERGY STAR Portfolio Manager sync
Energy, water, cost & emissions dashboards
Benchmarking & anomaly detection
Signal
Directional confidence before capital
$
29 /building/month
Everything in Monitor
System-assumed projects (archetype-based ECMs)
Operational surveys to refine assumptions
Directional cost, savings & emissions ranges
Blueprint
Defensible planning and prioritization
$
99 /building/month
Everything in Signal
Decarbonization roadmap & scenarios
Project sequencing & prioritization
Incentives workflow
Incentive-adjusted economics
Popular
Execute
Proving results, not just predicting them
$
199 /building/month
Everything in Blueprint
Capital planning & scenario comparison
Trade-off analysis across cost, risk & sustainability
Measurement & Verification (BAU vs promised vs actual)
Feedback loops into future strategy
Managed
Continuity when internal capacity is limited
$
699 /building/month
Everything in Execute
SPG-managed audits & BCAs
Model creation, interpretation & maintenance
Hands-on advisory support
End-to-end continuity
Results That Matter
Strategic insight and insightful reporting that strengthens accountability and funding.
Cost Savings
Evaluate utility costs and potential savings across your portfolio of buildings
Monitor Building Performance
Track performance metrics and benchmark usage across all buildings
Funding Readiness
Strengthens accountability and supports available funding applications
Environmental Stewardship
Support sustainability goals tied to measurable, year-round performance data
Collaborative Software
Everyone sees the same data, aligning teams around a single source of truth
Energy Sovereignty
Own your energy decisions with data-driven insights you control
PLATFORM PREVIEW
See JOBI in Action
Explore how JOBI brings your energy data together from audits and bills to real-time performance monitoring and strategic planning.
Track
Breakdown
Compare
Benchmark
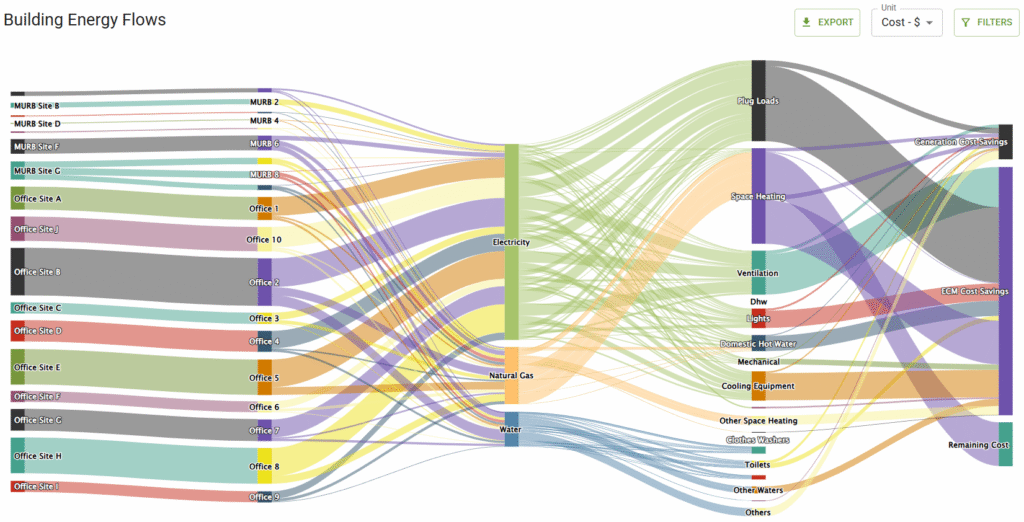
Flows
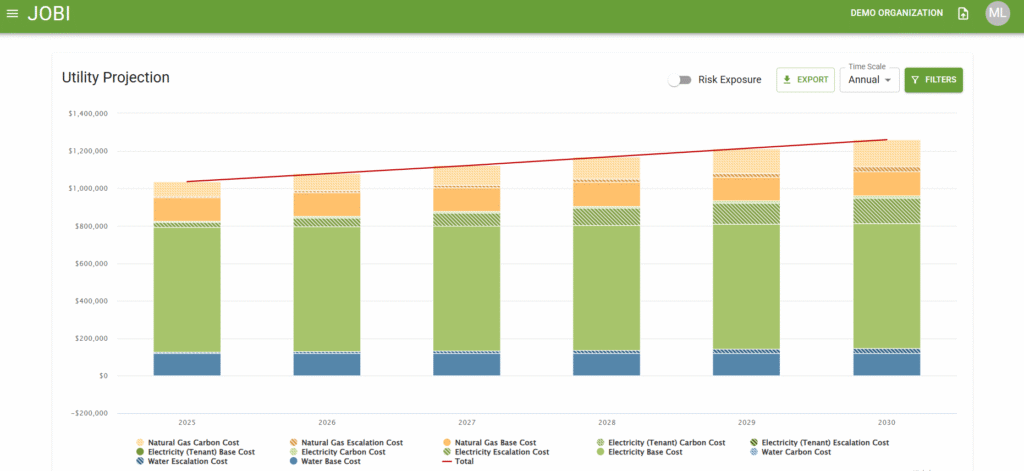
Forecast
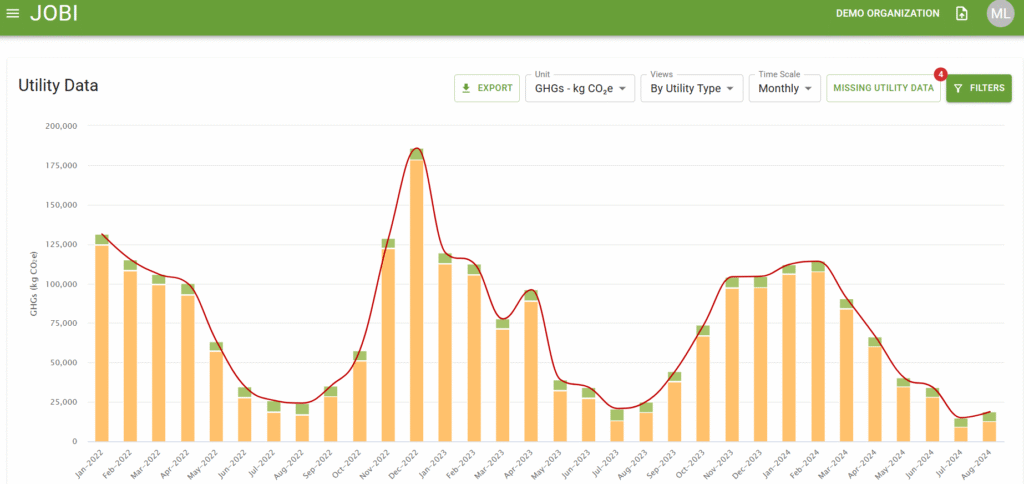
Track Utility Consumption & Emissions!
Monitor GHG emissions and utility costs over time with granular monthly breakdowns. Instantly spot seasonal patterns, anomalies, and trends across your entire portfolio. Let nothing slips through the cracks.
Filter by utility type, time scale, and unit to surface the insights that matter most.
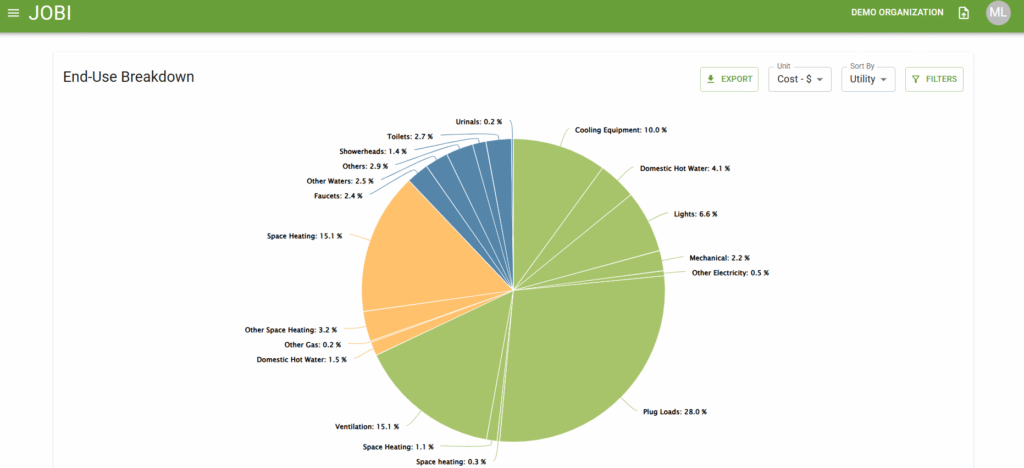
Break down energy consumption by end-use category to identify the biggest cost and carbon drivers. See exactly how much goes to plug loads, space heating, ventilation, cooling, and more. Empower every targeted retrofit decisions.
Sort by cost, energy, or utility type for instant clarity on your largest opportunities.
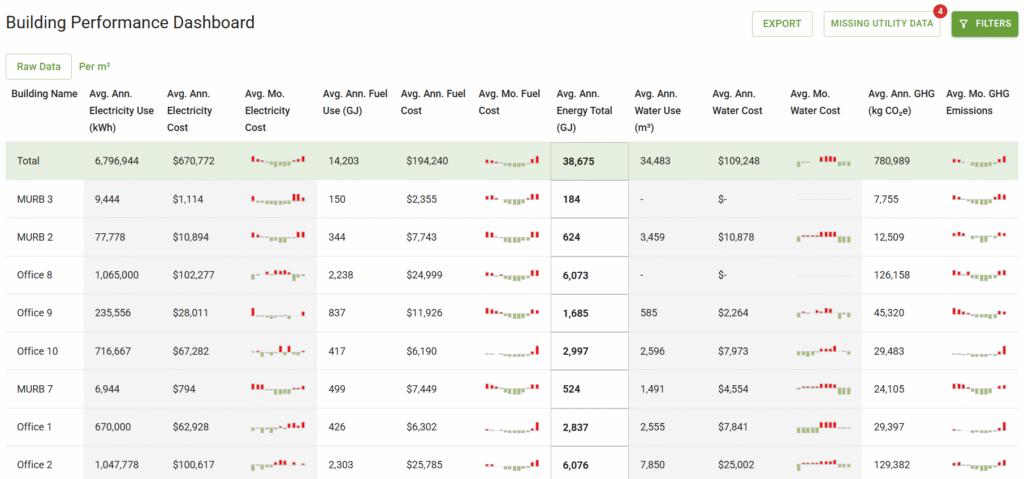
A unified dashboard that benchmarks every building in your portfolio side by side. See electricity, fuel, water costs, energy totals, and GHG emissions with embedded sparklines that reveal monthly trends without leaving the table.
Toggle between raw data and per-m² normalization for fair cross-building comparisons.
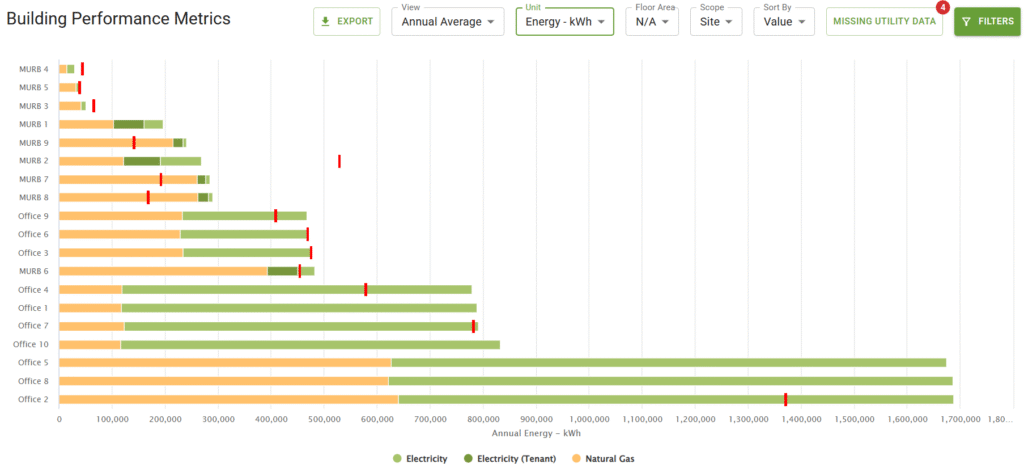
Rank buildings by annual energy consumption broken down by electricity, tenant electricity, and natural gas. Instantly identify your highest consumers and target them for efficiency upgrades, backed by data, not guesswork.
Sort by value, floor area, or scope to align benchmarking with your organizational priorities.
Trace how energy moves from sites and buildings through fuel types to end-use categories and ultimately to cost savings. This Sankey diagram reveals hidden interdependencies and highlights where the greatest cost-reduction opportunities exist.
Switch between cost, energy, and GHG views to align flow analysis with your strategic goals.
Project future utility costs with carbon pricing, escalation rates, and base costs layered in. Toggle risk exposure overlays to stress-test your strategy against regulatory changes and market volatility, years before they hit your budget.
Annual and monthly projections give you both the strategic view and operational detail.